Brief -
Managers need more insight to past, present, and future sale opportunities. They need to track how their individual team members are progressing throughout the fiscal year and quarter. Currently this is done across 3+ tools with multiple workflows that start and end in different places.
Testing Solutions -
As a manager it’s imperative to know who your sellers are contacting and what software they are selling. To achieve this we used the two most important metrics for any business: time and money. Tracking how their team is doing weekly, quarterly, or yearly allows the manager to adjust and coach their sellers so that they achieve their targeted goals.
For the first phase of user testing we wanted to test our high-level ideas rather than the product as a whole. From there we would adjust and work in the requested changes to future testing iterations.
1. Contextual team search
2. Stack bar chart with sales #
3. KPI gives quick view of the data
4. Table of individual sales
High Fidelity -
One of the problems we ran into with our user testing group was the inability to look beyond the gray and placeholder text. Looking back we could have prepared better for this by adding more color and business language. We were fortunate that it happened early in our testing rather than later. This gave us a chance to adjust and come to the next phases of testing with higher fidelity compositions.
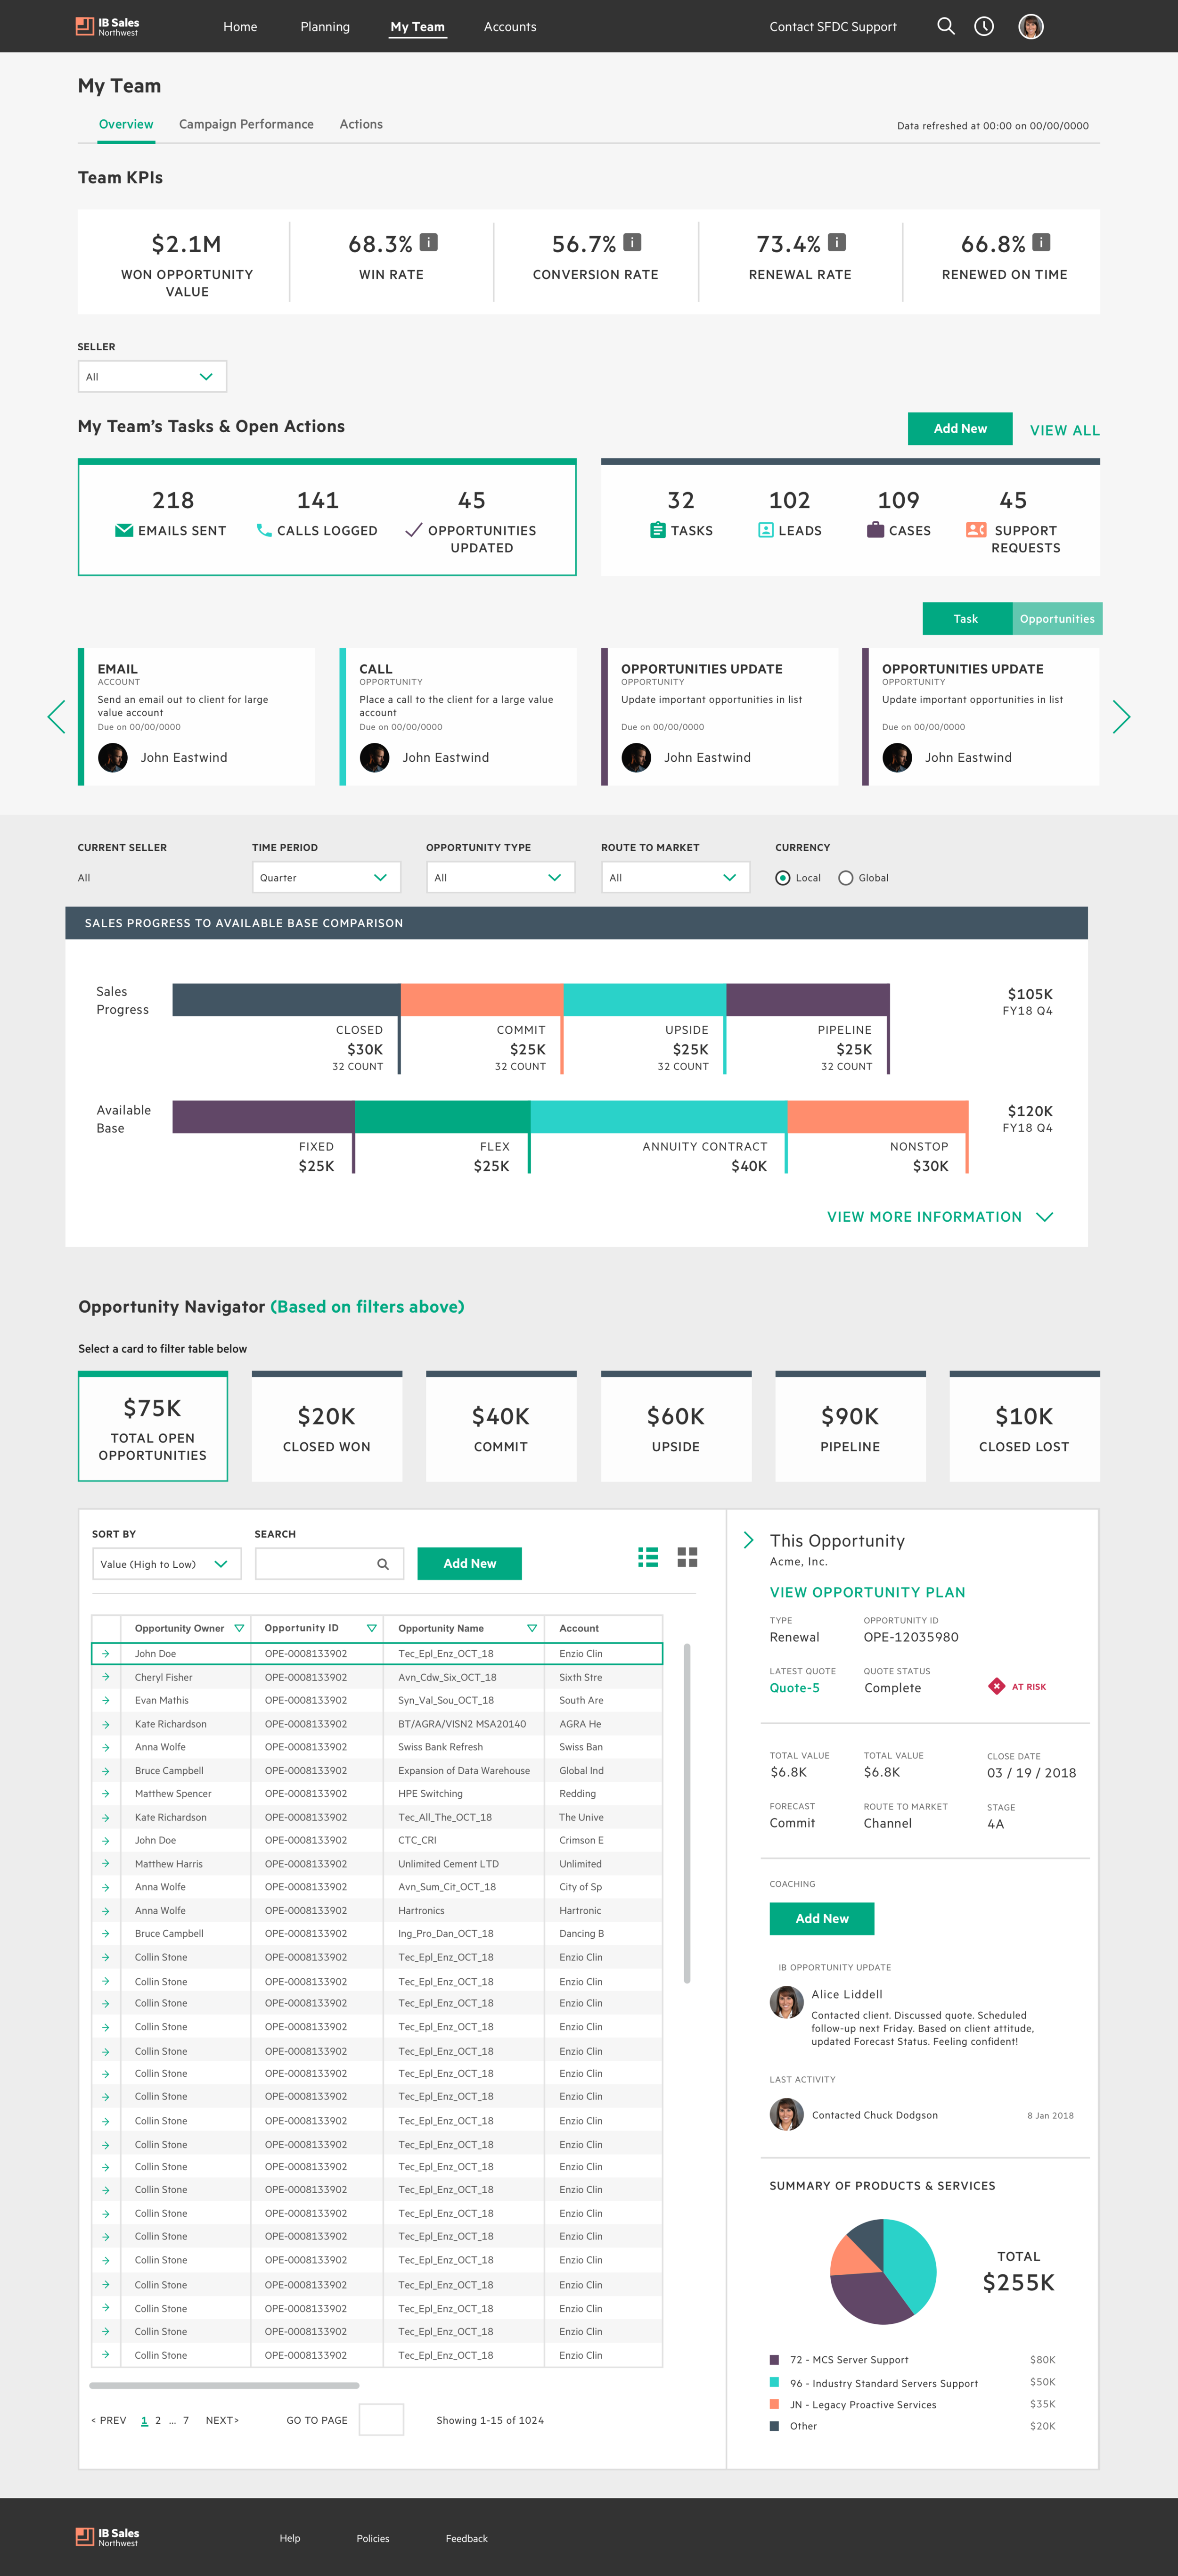
Starting from the top we have team-wide metrics detailing their total pipeline value, their win percentage, the conversion rate (the percentage of sales that went from open to closed), renewal rate, and renewed on time percentage. These metrics allow the manager to compare the current selected seller to their overall team.
Continuing down the page is the Tasks & Actions section. This area displays team metrics at-a-glance. The manager can see how many times their team has contacted a customer as well as the open tasks that they have assigned their teammates.
The main graph on the Team Overview displays the current sales stage of an opportunity compared to their available base (Currently sold install base with potential to sell). These two metrics, when compared to each other, gives the manager insight on where to coach their sellers. As an example: let’s say you have a seller with a large ‘Commit’ (commit = working out the deal, not yet sold) section of the pipeline. The manager might create a task for the seller to convert these to sold so that they can reach their team-wide or personal goal for sales.
Finally is the Opportunity Navigator broken up by 6 categories: Open, Closed-won, Commit, Upside, Pipeline, and Closed-lost. This allows the manager to see every opportunity their team is managing; furthering their insight and coaching capabilities.
Finalizing -
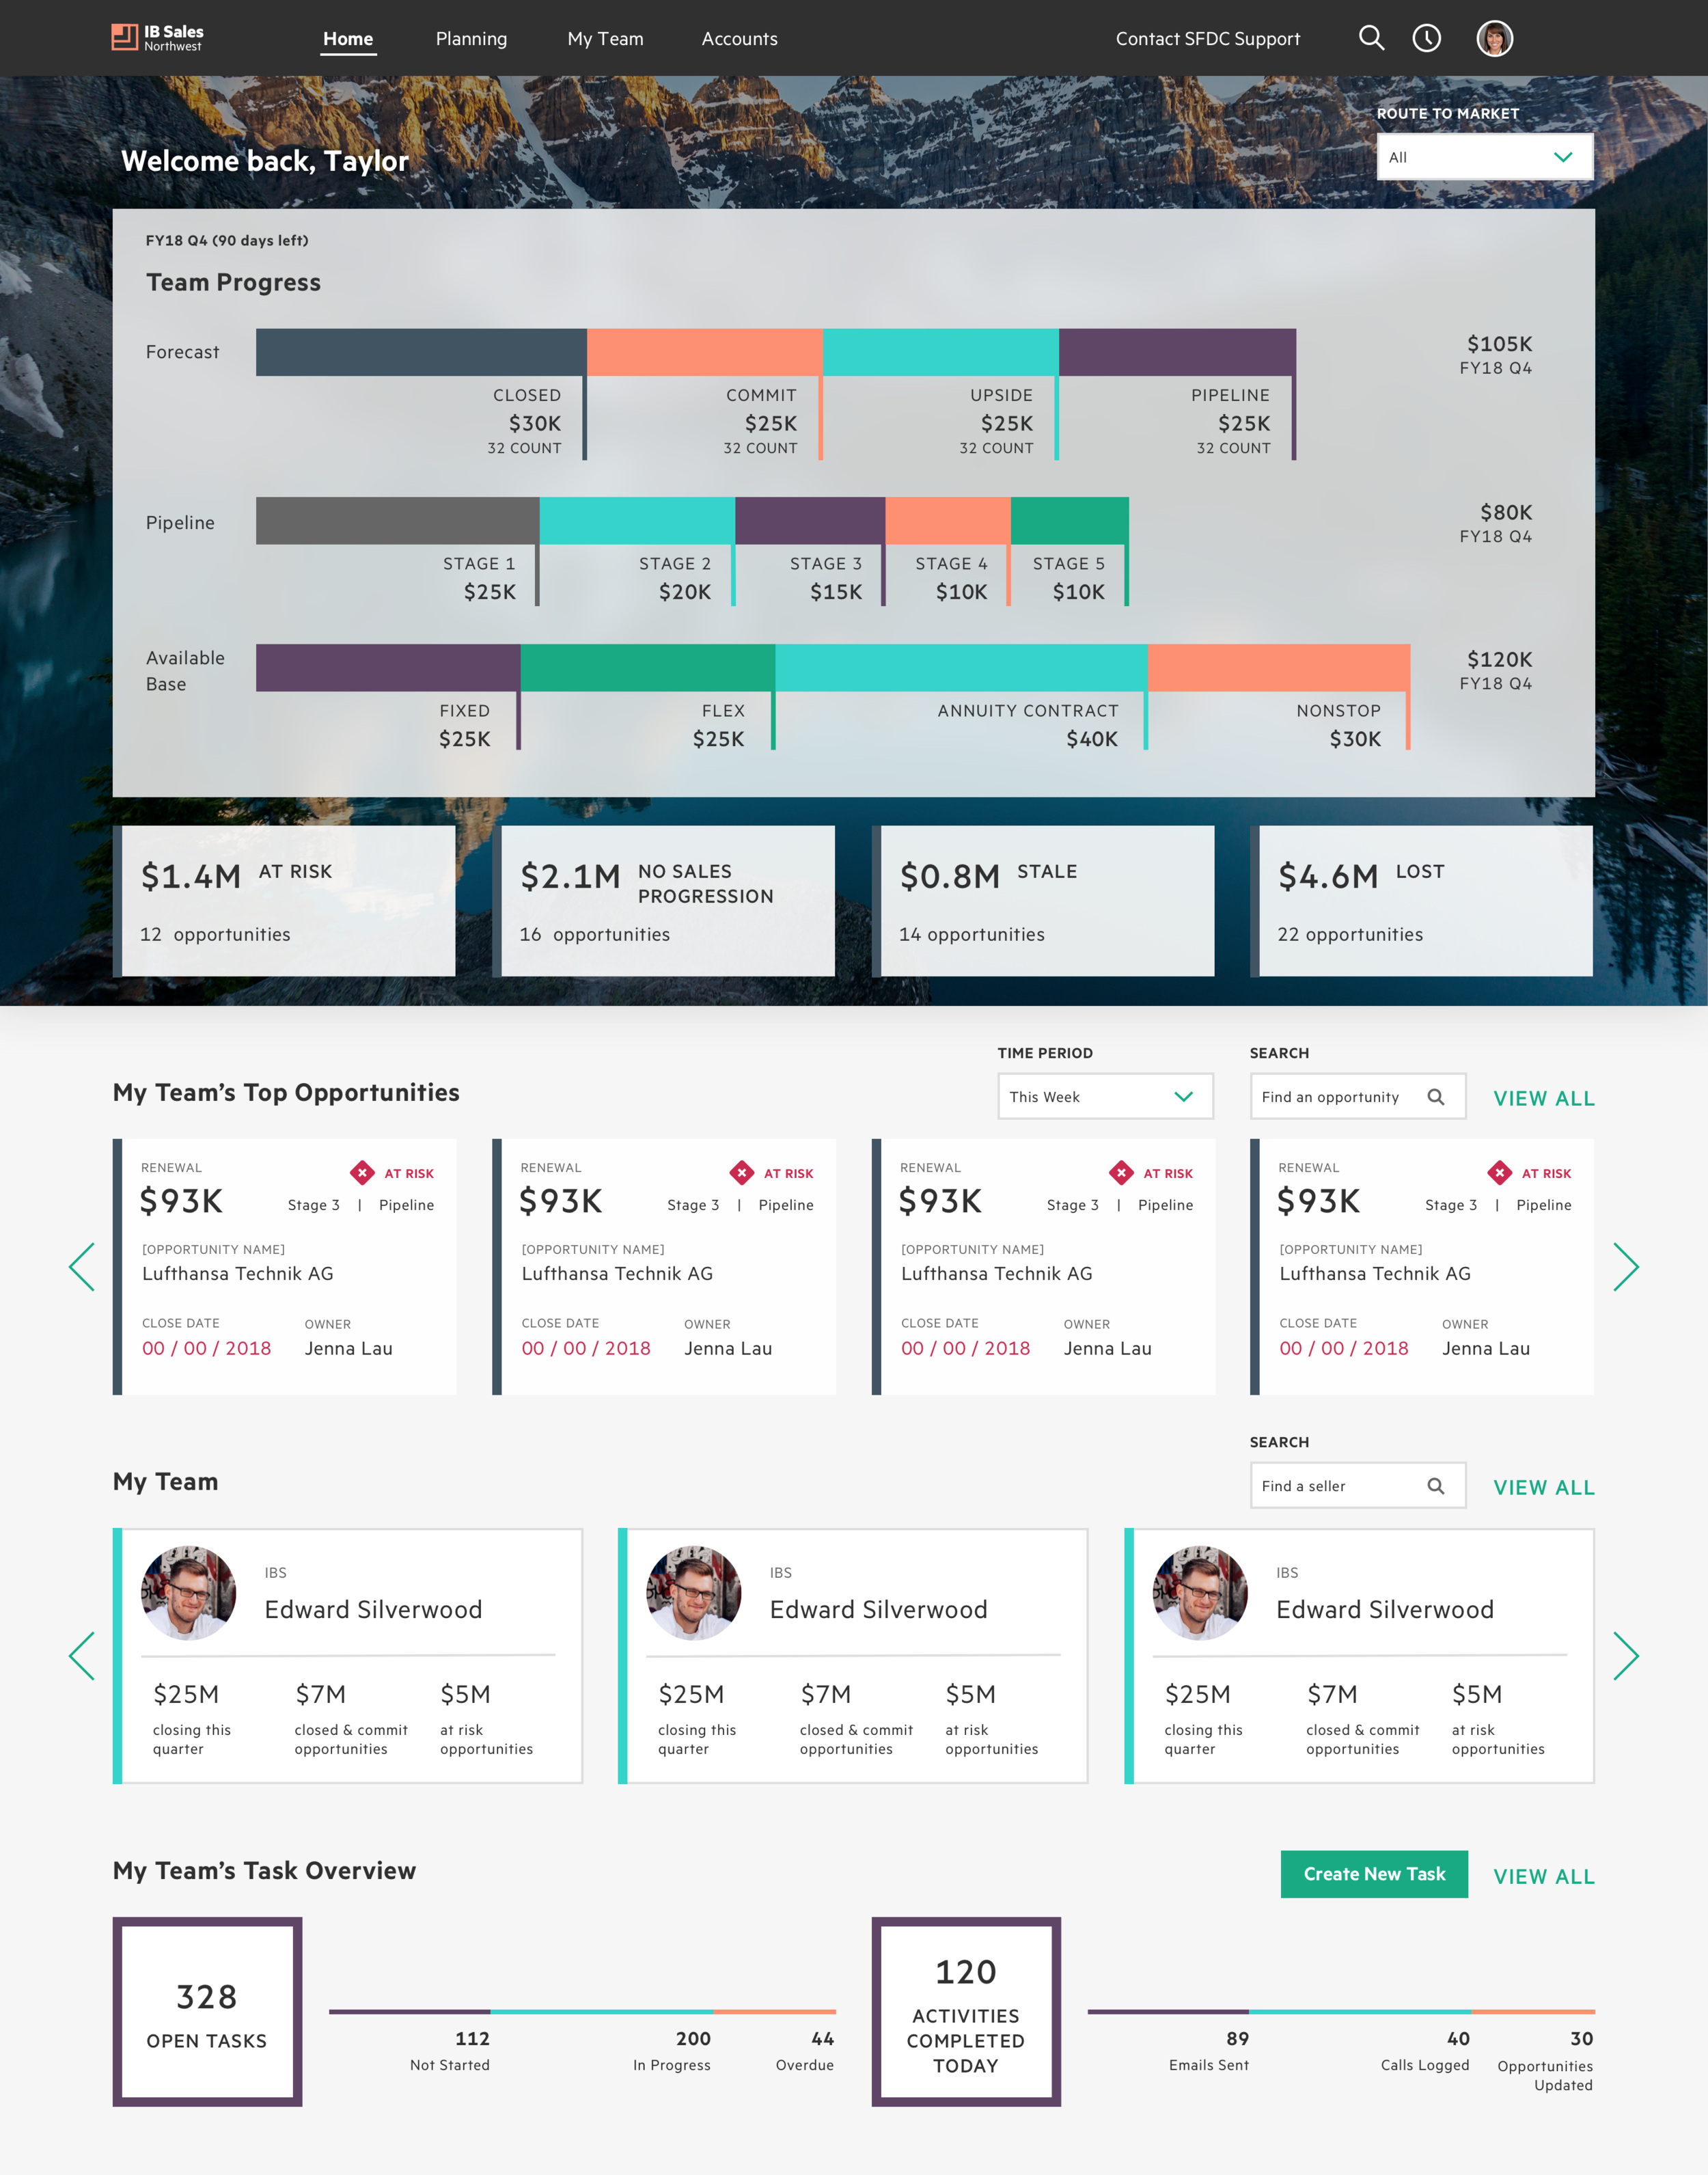
The most important consideration we made to all of our designs is purpose. A BI tool without thoughtfully displayed information, no matter how pretty, is not useful. Our final designs attempt to make every interaction a potential to act on what is being seen. We wanted to completely shift away from the siloed experiences that the previous tools used.


